Monitoring Survey Responses
Once survey invitations have been sent, to view the mailout statistics:
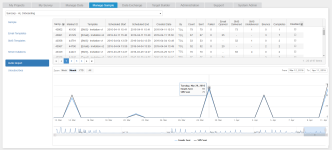
- Click on the Invite Report button

- The table at the top of the screen will show the statistics for each mailout:
- Sample ID - the unique identifier allocated to the sample file when imported
- Mailout ID - the unique identifier allocated to the mailout at the time of sending
- Template - the email or SMS template used for the mailout
- Scheduled Start - the date and time that the mailer started sending the invitations
- Scheduled End - the date and time that the mailer finished sending the invitations
- Created Date - the date and time that the mailout was initiated
- By - the user who initiated the mailout
- Count - the number of records in the sample
- Sent - the number of invitations sent
- Failed - the number of invitations that failed to send
- Email Opened - the number of emails opened by recipients
- SMS Delivered - the number of SMS messages delivered
- SMS Undelivered - the number of SMS messages that were unable to be delivered
- Bounce - the number of emails that were unable to be delivered
- Completes - the number of completed surveys resulting from the mailout
- Disabled - whether the mailout is enabled or disabled.
- The line chart at the bottom of the screen will show the time series - hover the mouse over any point in the time line to view the number of emails and/or SMS messages sent on that day
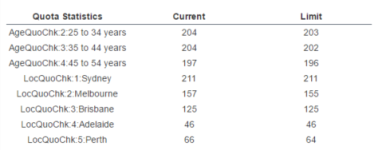
To monitor survey quotas that have been specified in the survey:
- Click on the My Projects tab in the Control Panel and select the required project from the drop down list.
- In the Survey Health Statistics panel, scroll down to view the Quota Statistics (click on the “More” button if required to view all quota groups)
- The quota limit is displayed in the right-hand column, the current number of completes within that quota group is displayed in the left column.
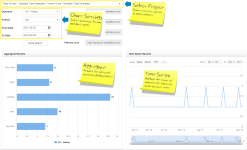
Results for any individual question may be monitored over time via the Aggregate and Time Series charts on the My Survey page in the Control Panel.
Aggregate Results
To view the real time responses to an individual survey question:
- Ensure that the correct project is selected in the project drop down box at the top of the screen.
- Select the desired question via the drop down box.
- Select the date range that you wish to display.
- The aggregate results for the selected question will be automatically displayed on the left of screen. By default, results are displayed as a bar chart. The chart type can be changed at any stage via the Format drop down.
Time Series Results
To view the number of responses to an individual question over time:
- Ensure that the correct project is selected in the project drop down box at the top of the screen.
- Select the desired question via the drop down box.
- Select the date range that you wish to display.
- The time series results for the selected question will be automatically displayed in the chart on the right of screen. The visible date range can be changed via the slider bar at the bottom of the chart. Hover over any data point in the chart to view the number of complete responses to the question on a specific day.
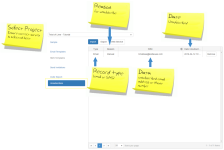
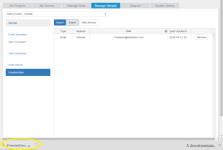
Survey respondents may choose to unsubscribe from surveys by clicking on the unsubscribe link in an email invitation, or by replying to an SMS invitation with the unsubscribe keyword. Whilst the Control Panel mailer automatically handles unsubcribes (anyone who has unsubscribed will be automatically excluded from future mailouts), details of those no longer willing to participate in surveys should be passed back to the source (or owner) of the sample so that they can update their database accordingly. This can be done by exporting the unsubscribes for the project.
To export unsubscribes:

